(Info) Amenities in Villages and Households
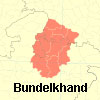
Bundelkhand
Infrastructure
Amenities in Villages and Households
The tables below give data from Census 2001 on education, health, and communication facilities in Bundelkhand’s villages, and electricity and toilet facilities in households.
One can expect that under most parameters, the situation in 2008 would have been better than what is indicated by census figures, and this is in fact reflected in publications like the MP Human Development reports published after 2001.
However, for the sake of credibility and uniformity that enables meaningful comparisons, only Census 2001 figures are provided. Comparisons with other surveys, which were carried out at another time, by another agency, and/or using different criteria, can be confusing and misleading. For example, state government data on villages with electricity cannot be compared with Census 2001 data on households on with electricity (the latter is more meaningful).
| Inhabited villages |
Villages with | ||||||||
| Primary School | Middle School | Secondary School | Primary health centre | Primary health sub-centre | P&T office | Bus service | Pucca road access | ||
| Jhansi | 750 | 464 | 203 | 40 | 15 | 41 | 381 | 146 | 435 |
| Lalitpur | 697 | 569 | 155 | 14 | 13 | 19 | 247 | 201 | 300 |
| Jalaun | 937 | 822 | 259 | 77 | 22 | 52 | 475 | 139 | 514 |
| Hamirpur | 521 | 464 | 189 | 24 | 17 | 65 | 245 | 120 | 353 |
| Mahoba | 421 | 358 | 99 | 11 | 8 | 24 | 134 | 54 | 197 |
| Banda | 682 | 590 | 246 | 35 | 14 | 33 | 243 | 112 | 374 |
| Chitrakoot | 545 | 430 | 135 | 38 | 17 | 18 | 124 | 57 | 211 |
| UP Bundelkhand | 4553 | 3697 | 1286 | 239 | 106 | 252 | 1849 | 829 | 2384 |
| Datia | 551 | 512 | 128 | 63 | 9 | 92 | 408 | 129 | 197 |
| Chhatarpur | 1080 | 970 | 238 | 98 | 28 | 152 | 252 | 274 | 345 |
| Tikamgarh | 865 | 808 | 229 | 172 | 17 | 149 | 196 | 220 | 276 |
| Panna | 955 | 811 | 200 | 87 | 15 | 109 | 194 | 159 | 241 |
| Damoh | 1175 | 910 | 169 | 61 | 14 | 159 | 288 | 229 | 372 |
| Sagar | 1901 | 1427 | 320 | 102 | 24 | 222 | 420 | 360 | 436 |
| MP Bundelkhand | 6527 | 5438 | 1284 | 583 | 107 | 883 | 1758 |
1371 | 1867 |
Source: District-wise basic data sheets of Census 2001. Figures for UP Bundelkhand and MP Bundelkhand derived by aggregating district figures
Amenities in Households (Census 2001)
| District | Households with electricity (%) | Households with toilets (%) |
| Jhansi | 43.3 | 35.2 |
| Lalitpur | 20.3 | 17.2 |
| Jalaun | 26.3 | 35.4 |
| Hamirpur | 17.2 | 24.4 |
| Mahoba | 15.8 | 21.8 |
| Banda | 15.2 | 20.2 |
| Chitrakoot | 16.9 | 12.5 |
| Datia | 67.4 | 21.4 |
| Chhatarpur | 46.6 | 15.3 |
| Tikamgarh | 49.3 | 11 |
| Panna | 34.6 | 11.1 |
| Damoh | 64.7 | 13.9 |
| Sagar | 69.2 | 21.3 |
Source: Census 2001 data quoted in Ranking and Mapping of Districts Based on Socio-economic and Demographic Indicators, International Institute for Population Sciences (IIPS), Mumbai, 2006
Go Back To Main Page
Courtesy : bundelkhandinfo.org
- Anonymous's blog
- Log in to post comments