(Info) Agriculture in Bundelkhand
Bundelkhand
Agriculture
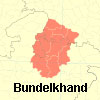
While agriculture in the predominant occupation in Bundelkhand (see Employment Sources in Bundelkhand), land available and used for cultivation in the region is considerably lower than in other agriculture zones of the country.
In Western UP, for instance, over 75% of the total area is used for cultivation. Such high coverage is seen only in the Bundelkhand Plain sub-region, in Hamirpur, Jalaun and Banda districts; over 70% of total area is used for cultivation in Jhansi and Mahoba districts also (see table in Land Use in Bundelkhand).
However, due to large area of wasteland in the Bundelkhand Intermediate Region and Bundelkhand Upland sub-regions, the percentage of land used for cultivation falls drastically, to around 50% in Chitrakoot and Lalitpur districts, and less than that in Chhatarpur, Tikamgarh and Damoh districts; in Panna, only around 35% of total area is cultivated. In Sagar and Datia districts, the percentage is around 53 and 67 respectively.
Apart from size of land cultivated, agriculture production is primarily determined by availability of water. Irrigation supports multiple cultivation over a year, and offers considerable protection against vagaries of monsoon.
Till the 1970s, less than 15% of the cultivated land in Bundelkhand was irrigated. However, completion of dam projects led to an increase of around 40% in irrigated land by the mid-1980s, with largest absolute increase recorded in Lalitpur district [Tyagi, p 169].
Since the 1980s, the total area irrigated has more than doubled in Jhansi, Jalaun, Chhatarpur and Tikamgarh districts, trebled in Lalitpur and Datia districts, and increased by over five times in Panna, Damoh and Sagar districts, according to a comparison of figures quoted in a publication of the Indian Grassland and Fodder Research Institute, Jhansi [Tyagi, p 167] with figures in Table 1 below.
However, as most recent available Government of India figures (shown in Table 1 below) indicate, in UP Bundelkhand, the percentage of total irrigated land remains well below the state average, at around 42% of total sown land; it is particularly low in Chitrakoot district.
In MP Bundelkhand, percentage of total irrigated land in is higher than the state average, at nearly 40% of total sown land. However, none of the districts of MP Bundelkhand rank among MP's top districts in the yield of any crop, due to factors such as soil quality, use of fertilisers and seed replacement rate.
Table 1: Irrigated area as percentage of total sown area in UP Bundelkhand (2002-03) and MP Bundelkhand (2005-06)
| Total area sown*(ha) | Total area irrigated(ha)** | % total area sown that is irrigated | |
| Jhansi | 465240 | 223027 | 47.9 |
| Lalitpur | 385426 | 210013 | 54.5 |
| Jalaun | 437205 | 191399 | 43.8 |
| Hamirpur | 352531 | 111508 | 31.6 |
| Mahoba | 292021 | 114944 | 39.4 |
| Banda | 422544 | 174065 | 41.2 |
| Chitrakoot | 193321 | 53450 | 27.6 |
| UP Bundelkhand | 2548288 | 1078406 | 42.3 |
| UP | 25424605 | 18523956 | 72.8 |
| Datia | 228465 | 136302 | 59.6 |
| Chhatarpur | 511319 | 226581 | 44.3 |
| Tikamgarh | 370642 | 206778 | 55.8 |
| Panna | 297655 | 84420 | 28.4 |
| Damoh | 398648 | 114138 | 28.6 |
| Sagar | 710690 | 236635 | 33.3 |
| MP Bundelkhand | 2517419 | 1004854 | 39.9 |
| MP | 19607592 | 5878311 | 30 |
Source: District-wise Land Use Statistics, Ministry of
Agriculture, Government of India, May 2008. Percentages rounded off.
*Total sown land includes area sown more than once; the area is counted as many
times as there are sowings in a year.
**Total irrigated area is the total area under crops, irrigated once and/or more
than once in a year. Area covered by any source of irrigation is considered
irrigated area.
(Note: There is considerable variation in irrigated area figures across reporting years, and reporting authorities. Percentages derived from figures for net irrigated area will be higher than figures for total irrigated area given in the table above. 'Net irrigated area' refers only to the area irrigated once in a year for a particular crop - it does not take into account the number of crops grown in the same area, in the same year.)
One other factor that affects productivity, and is not captured by data on quantum of irrigation, is quality of irrigation, which relates to required quantum of water supplied at the right time. Quality of irrigation in Bundelkhand is much affected by poor maintenance of canals, erratic and irregular supply of water from dams, and quick depletion of groundwater sources due to the region’s geology and topography.
Size of operational (cultivated) land holdings is another factor affecting production, especially in absence of use of advanced cultivation technologies.
Medium and large holdings account for 30% to 45% of area of all holdings across Bundelkhand districts (see Land Holdings in Bundelkhand). Theoretically, a larger holding should enable greater capital formation and greater investment in production-enhancing use of fertilisers, improved seeds and modern agriculture equipment. However, due to inherently unfavourable conditions for agriculture in much of the region, this is not seen in Bundelkhand.
Overall, we thus get a picture of low-productivity-agriculture, except in some areas and in some crops.
Cropping Patterns
Although the rainfall pattern and the extent of irrigation in Bundelkhand theoretically favours kharif (monsoon) cultivation, most of the land is cultivated in the rabi (post-monsoon) season.
Area cultivated more than once a year does not generally exceed 30% of total cultivated area, except in Jhansi, Lalitpur, Sagar and Tikamgarh districts (Table 2 below). Cropping intensity of above 150%, equivalent to that in Western UP, is seen only in Tikamgarh district.
(Cropping intensity is ratio of total area sown - or gross cropped area - and net sown area. Under 'gross cropped area', which is shown in the second column of Table 1 above, area is counted as many times as there are sowings in a year. Under 'net sown area', area sown more than once in the same year is counted only once).
Table 2: Cropping intensity in UP Bundelkhand (2002-03) and MP Bundelkhand (2005-06)
|
|
Net area sown in year(ha) |
Area sown more than once in year (ha) |
Cropping intensity (%) |
|
Jhansi |
346423 |
118817 |
134 |
|
Lalitpur |
265712 |
119714 |
145 |
|
Jalaun |
348445 |
88760 |
125 |
|
Hamirpur |
302514 |
50017 |
117 |
|
Mahoba |
244581 |
47440 |
119 |
|
Banda |
348600 |
73944 |
121 |
|
Chitrakoot |
172052 |
21269 |
112 |
|
UP Bundelkhand |
2028327 |
519961 |
126 |
|
UP |
16749534 |
8675071 |
152 |
|
Datia |
197242 |
31223 |
116 |
|
Chhatarpur |
403863 |
107456 |
127 |
|
Tikamgarh |
240951 |
129691 |
154 |
|
Panna |
251523 |
46132 |
118 |
|
Damoh |
311037 |
87611 |
128 |
|
Sagar |
539003 |
171687 |
132 |
|
MP Bundelkhand |
1943619 |
573800 |
130 |
|
MP |
14970966 |
4636626 |
131 |
Source: District-wise Land Use Statistics, Ministry of Agriculture, Government of India, May 2008. Figures for area sown more than once a year derived by subtracting net sown area figures from total sown area figures in Table 1 above. Percentages rounded off.
Cropping intensity varies widely across years. Between the late 1970s to early 1990s area sown in the kharif (monsoon) season in UP Bundelkhand ranged between 28% to 35% of total cropped area but, in 1998-99, after years of poor or erratic rainfall, it fell to 23% of total cropped area, reported a study by Sanjay Vijayvergiya for Oxfam India Trust. In 2002-03, as shown in the table, it fell to 26%. As noted in Drought and Flood in Bundelkhand, successive years of poor or erratic rainfall are a frequent occurrence in Bundelkhand.
Main Crop Categories
UP Bundelkhand is predominantly a pulses-growing country, especially when viewed against the UP average for land under cultivation of this category of crops (see Table 3 below and also Agricultural Production in Bundelkhand).
Wheat accounts for the largest area under cultivation in most districts (see Major and Minor Crops in Bundelkhand), but as the table below shows, there has been a huge drop in cultivation of cereals and millets as a whole in UP Bundelkhand since 1984-85. This would be on account of virtual disappearance of bajra and barley, and reduction in area under cultivation of jowar.
Table 3: UP Bundelkhand area under main crop categories, as % of total cropped area (2003-04)
|
|
Cereals and millets |
Pulses |
Oilseeds |
Fodder crops |
||||
|
|
1984-85 |
2003-04 |
1984-85 |
2003-04 |
1984-85 |
2003-04 |
1984-85 |
2003-04 |
|
Jhansi |
48.7 |
30 |
43.2 |
62 |
5.6 |
6.7 |
NA |
0.2 |
|
Lalitpur |
61.7 |
38.4 |
24 |
56.8 |
10 |
3.9 |
NA |
Neg |
|
Jalaun |
40.1 |
38.3 |
51.1 |
54.9 |
6.2 |
4 |
NA |
1 |
|
Hamirpur |
48 |
33.7 |
43.4 |
60.9 |
6.7 |
3 |
NA |
0.9 |
|
Mahoba |
H |
26.7 |
H |
64.8 |
H |
7 |
NA |
0.1 |
|
Banda |
61 |
56 |
36 |
41.1 |
11.6 |
1.4 |
NA |
0.8 |
|
Chitrakoot |
B |
56.5 |
B |
39.7 |
B |
2.1 |
NA |
0.6 |
|
UP Bundelkhand |
51.7 |
39.1 |
40.2 |
55 |
5.4 |
4.1 |
|
0.5 |
|
UP |
|
68.8 |
|
11 |
|
3 |
|
3.5 |
Table 4: MP Bundelkhand area under main crop categories, as % of total cropped area (2005-06)
|
|
Cereals and Millets |
Pulses |
Oilseeds |
Fodder crops |
||||
|
|
1984-85 |
2005-06 |
1984-85 |
2005-06 |
1984-85 |
2005-06 |
1980-81 |
2005-06 |
|
Datia |
45.6 |
36.7 |
41.2 |
43.5 |
10 |
16 |
0.8 |
1.0 |
|
Chhatarpur |
54 |
36.2 |
24.3 |
39.1 |
9.8 |
9.8 |
10.7 |
2.9 |
|
Tikamgarh |
62 |
36.1 |
15.7 |
25.3 |
8.7 |
23 |
12 |
5.2 |
|
Panna |
66.3 |
48.3 |
18 |
46 |
14.4 |
4.4 |
0.1 |
NA |
|
Damoh |
57.5 |
24.7 |
29.5 |
39.9 |
8.9 |
10.2 |
3.7 |
0.5 |
|
Sagar |
56.7 |
25.7 |
21.8 |
43.5 |
12.1 |
25.3 |
11.3 |
3.8 |
|
MP Bundelkhand |
57.8 |
32.5 |
23.5 |
37 |
10.8 |
17.7 |
8.8 |
|
|
MP |
|
38.2 |
|
22 |
|
30.8 |
|
3 |
Source: 2003-04 figures are from District-wise Land Use Statistics, Ministry of Agriculture, Government of India, May 2008. 1984-85 figures are from district statistical handbook figures quoted in Grassland & Fodder Atlas of Bundelkhand (Indian Grassland and Fodder Research Institute, Jhansi; 1997). Area under main crop categories is total of area under each crop of each category, in each season. Percentages derived from absolute figures. H=was part of Hamirpur district. B= was part of Banda district. NA= figures not available. Neg= Negligible
In MP Bundelkhand, there is more equal distribution of land under cereals and millets, and pulses, but here too area under the former category of crop has come down in almost the same proportion as in UP Bundelkhand since 1984-85 (Table 4 above).
A significant difference in cropping pattern in the two Bundelkhands is the area under oilseed cultivation: as percentage of total cropped area, oilseed cultivation in MP Bundelkhand is three times the UP Bundelkhand average, though much lower than the MP average. Both the UP and MP governments have hopes of promoting jatropha cultivation in the Bundelkhand districts in a big way, for production of bio-diesel.
Courtesy : bundelkhandinfo.org
- Anonymous's blog
- Log in to post comments