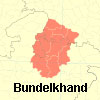
(Info) Current Population of Bundlekhand

Bundelkhand
(Info) Population of Bundlekhand
Current Population
Bundelkhand has a (Census 2001) population of around 15. 5 million.
The total population of UP Bundelkhand districts was around 8.2 million and the population of MP Bundelkhand districts was around 7.3 million, according to Census 2001 data.
The largest population was found in Sagar district (20.2 lakhs) and lowest population was found in Datia district (6.2 lakhs).
The table below shows three key characteristics of Bundelkhand's demographics:
By India standards, the region is marked by low population density. By Census 2001 figures, the population density of UP Bundelkhand as a whole works out to 280 persons per sq km - less than a third of the state average.
Related to low population density is low level of urbanisation. In all districts of Bundelkhand, except Jhansi and Sagar, over three-fourths the population was living in rural areas, according to Census 2001; in Chitrakoot district, less than 10% of the population resided in urban areas.
There is a clear variation in intra-regional distribution of population. There is higher population density in the Bundelkhand Plain areas (particularly in Jalaun and Banda), and Bundelkhand Intermediate region areas (particularly in Jhansi and Tikamgarh), and lower population density in Bundelkhand Upland (particularly in Panna and Chhatarpur) and the southern Damoh and Sagar plateaus.
However, in recent decades Bundelkhand has witnessed high population growth, as can be seen from population growth trends.
Basic demographic data (Census 2001) of Bundelkhand districts
| District | Population | Persons per sq km | Rural Pop (%) |
| Jhansi | 17,44,931 | 347 | 59.2 |
| Lalitpur | 9,77,734 | 192 | 85.5 |
| Jalaun | 14,54,452 | 319 | 76.6 |
| Hamirpur | 10,43,724 | 232 | 83.3 |
| Mahoba | 7,08,447 | 263 | 78.1 |
| Banda | 15,37,334 | 337 | 84.1 |
| Chitrakoot | 7,66,225 | 250 | 90 |
| Total UP districts | 82,32,847 | ||
| Datia | 6,28,240 | 224 | 78.1 |
| Chhatarpur | 14,74,723 | 171 | 78 |
| Tikamgarh | 12,02,998 | 238 | 82.3 |
| Panna | 8,56,558 | 122 | 87.4 |
| Damoh | 10,83,949 | 148 | 81.1 |
| Sagar | 20,21,987 | 197 | 70.8 |
| Total MP districts | 72,68,455 | ||
| Total UP + MP districts | 15,50,1302 | ||
| UP state average | 690 | 79.2 | |
| MP state average | 196 | 73.5 | |
| India average | 325 | 72.2 |
The table shows three key characteristics of Bundelkhand's demographics:
-
By India standards, the region is marked by low population density. By Census 2001 figures, the population density of UP Bundelkhand as a whole works out to 280 persons per sq km - less than a third of the state average.
-
Related to low population density is low level of urbanisation. In all districts of Bundelkhand, except Jhansi and Sagar, over three-fourths the population was living in rural areas, according to Census 2001; in Chitrakoot district, less than 10% of the population resided in urban areas.
-
There is a clear variation in intra-regional distribution of population. There is higher population density in the Bundelkhand Plain areas (Jalaun, Hamirpur, Banda), and Bundelkhand Intermediate region areas (Jhansi, Tikamgarh), and lower population density in Bundelkhand Upland (Panna) and the southern Damoh and Sagar plateaus.
However, in recent decades Bundelkhand has witnessed high population growth, as can be seen from population growth trends.
Courtesy : bundelkhandinfo.org
- Anonymous's blog
- Log in to post comments