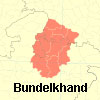
(Info) Land Use in Bundelkhand

Bundelkhand
Land Use in Bundelkhand
Land use pattern in UP Bundelkhand and MP Bundelkhand districts is not significantly different from the rest of UP and MP respectively. Net sown area in all MP Bundelkhand districts except Datia is considerably lower than in UP Bundelkhand. Around 7% of cultivable land in UP Bundelkhand and around 5% of cultivable land in MP Bundelkhand lies fallow in any year.
Note: In the table below, notified forest land includes land covered with degraded forest, or land with virtually no trees; actual forest cover, as revealed by satellite data, is lower (see Forest Cover in Bundelkhand).
Land use in UP Bundelkhand (2004-05) and MP Bundelkhand (2005-06) districts
| District | Total area in hectares | Percentage of total area under different uses | ||||||
| Notified forest land | Non-agri use |
Barren land |
Grazing land |
Under misc tree crops |
Cultivable wasteland |
Net sown | ||
| Jhansi | 5,01,329 | 6.9 | 8.4 | 6.3 | 0.1 | 0.2 | 3.1 | 68 |
| Lalitpur | 5,07,500 | 15 | 7.7 | 3 | 0.6 | 0.2 | 11.9 | 54.8 |
| Jalaun | 4,54,434 | 5.6 | 8 | 2.7 | 0.1 | 0.8 | 0.4 | 0.4 |
| Hamirpur | 3,90,178 | 6.2 | 8 | 2.4 | 0 | 0.2 | 1 | 79.1 |
| Mahoba | 3,27,429 | 4.9 | 11.3 | 2.6 | 0.1 | 0 | 3.5 | 72.8 |
| Banda | 4,38,767 | 1.2 | 6.7 | 2.6 | 0 | 0.3 | 2.5 | 80.1 |
| Chitrakoot | 3,38,897 | 16.4 | 8.3 | 7.1 | 0 | 8.4 | 3.2 | 51.3 |
| UP Bundelkhand | 29,48,534 | 8 | 8.2 | 3.8 | 0.2 | 1.2 | 3.9 | 69 |
| UP | 2,42,01,294 | 7 |
10.9 |
2.1 |
0.3 |
1.4 |
1.9 |
68.9 |
| Datia | 2,95,874 |
8.4 |
7.3 |
4.9 |
1.5 |
0.9 |
5.2 |
66.7 |
| Chhatarpur | 8,63,036 |
24.8 |
5.1 |
0.2 |
7.4 |
0 |
7.5 |
46.8 |
| Tikamgarh | 5,04,002 |
13.7 |
4.7 |
14.2 |
4.6 | 0 |
4.2 |
47.8 |
| Panna | 7,02,924 |
42.6 |
5.9 |
3.2 |
1.2 |
NA | 8 |
35.8 |
| Damoh | 7,28,583 |
36.8 |
4.4 |
8.1 |
4.6 |
0 |
1.8 |
42.7 |
| Sagar | 10,22,759 |
29.1 |
5.1 |
1.9 |
8 |
0 |
0.9 |
52.7 |
| MP Bundelkhand | 41,17,178 |
28.5 |
5.2 |
4.6 |
5.2 |
4.4 | 47.2 | |
| MP | 3,07,55,752 |
28.3 |
6.3 |
4.7 |
4.3 |
0 |
3.8 |
48.7 |
Source: District-wise Land Use Statistics, Union Ministry of Agriculture, May 2008. Percentages derived from absolute figures and rounded off. Note: Fallow land categories are not included. NA= Not available.
Courtesy : bundelkhandinfo.org
- Anonymous's blog
- Log in to post comments